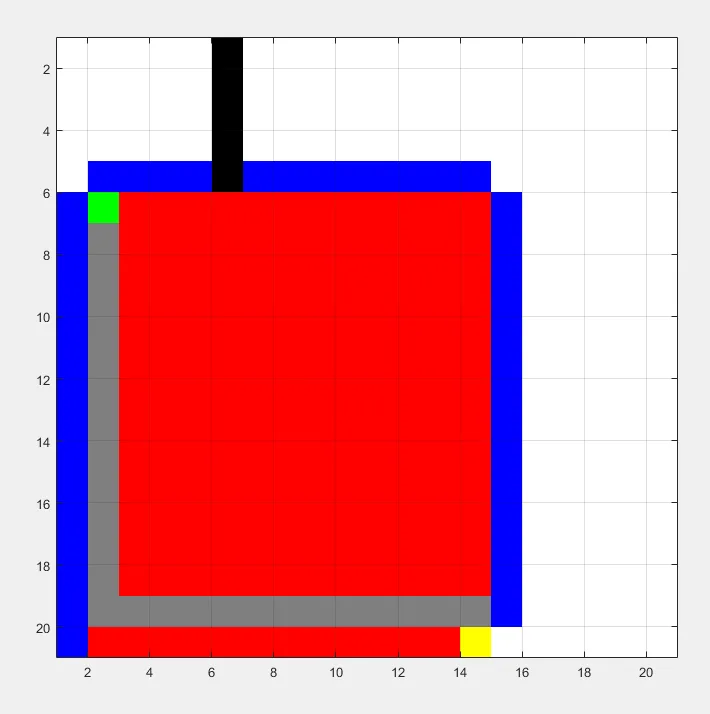
An explanation of heuristic grid search, with the class implementation below.
A* Algorithm
On each iteration, A* selects the open cell with the smallest estimated total cost, f = g + h. Here, g is the cost of the path from the start and h is the Manhattan-distance estimate to the destination. The implementation considers four neighbouring cells with unit movement costs; diagonal movement is not included. Unlike Dijkstra’s algorithm, which selects by the accumulated cost alone, A* also uses the heuristic to direct its search towards the goal.
Implementation Context
The class code below accumulates actual path cost, preserves row/column ordering on rectangular maps and stores parent indices directly. Its Manhattan heuristic matches four-neighbour unit-cost movement; setting the heuristic to zero gives the Dijkstra selection rule, while the historical screenshots are examples rather than newly measured benchmarks.
Testing and Real-World Use
This could be tested on free, obstructed and rectangular grids by checking that each returned route uses adjacent free cells and matches an independently computed shortest-path cost. A* is useful for goal-directed search on a known map, but a point route does not establish clearance or motion feasibility for a physical robot.
 function [route,numExpanded] = AStarGrid (input_map, start_coords, dest_coords)
% Run A* algorithm on a grid.
% Inputs :
%   input_map : a logical array where the freespace cells are false or 0 and
%   the obstacles are true or 1
%   start_coords and dest_coords : Coordinates of the start and end cell
%   respectively, the first entry is the row and the second the column.
% Output :
%    route : An array containing the linear indices of the cells along the
%    shortest route from start to dest or an empty array if there is no
%    route. This is a single dimensional vector
%    numExpanded: Remember to also return the total number of nodes
%    expanded during your search. Do not count the goal node as an expanded node.

% set up color map for display
% 1 - white - clear cell
% 2 - black - obstacle
% 3 - red = visited
% 4 - blue  - on list
% 5 - green - start
% 6 - yellow - destination

cmap = [1 1 1; ...
    0 0 0; ...
    1 0 0; ...
    0 0 1; ...
    0 1 0; ...
    1 1 0; ...
    0.5 0.5 0.5];

colormap(cmap);

% variable to control if the map is being visualized on every
% iteration
drawMapEveryTime = true;

[nrows, ncols] = size(input_map);

% map - a table that keeps track of the state of each grid cell
map = zeros(nrows,ncols);

map(~input_map) = 1;   % Mark free cells
map(input_map)  = 2;   % Mark obstacle cells

% Generate linear indices of start and dest nodes
start_node = sub2ind(size(map), start_coords(1), start_coords(2));
dest_node  = sub2ind(size(map), dest_coords(1),  dest_coords(2));

% A blocked endpoint is not a traversable start or goal.
if input_map(start_node) || input_map(dest_node)
    route = [];
    numExpanded = 0;
    return;
end

map(start_node) = 5;
map(dest_node)  = 6;

% meshgrid will `replicate grid vectors' nrows and ncols to produce
% a full grid
% type `help meshgrid' in the Matlab command prompt for more information
parent = zeros(nrows,ncols);

%
[X, Y] = meshgrid (1:ncols, 1:nrows);

xd = dest_coords(1);
yd = dest_coords(2);

% Evaluate Heuristic function, H, for each grid cell
% Manhattan distance
H = abs(Y - xd) + abs(X - yd);
% Initialize cost arrays
f = Inf(nrows,ncols);
g = Inf(nrows,ncols);

g(start_node) = 0;
f(start_node) = H(start_node);

% keep track of the number of nodes that are expanded
numExpanded = 0;

% Main Loop

while true

    % Draw current map
    map(start_node) = 5;
    map(dest_node) = 6;

    % make drawMapEveryTime = true if you want to see how the
    % nodes are expanded on the grid.
    if (drawMapEveryTime)
        image(1.5, 1.5, map);
        grid on;
        axis image;
        drawnow;
    end

    % Find the node with the minimum f value
    [min_f, current] = min(f(:));

    if ((current == dest_node) || isinf(min_f))
        break;
    end;

    % Update input_map
    map(current) = 3;
    f(current) = Inf; % remove this node from further consideration

    % Compute row, column coordinates of current node
    [i, j] = ind2sub(size(f), current);

    % *********************************************************************
    % ALL YOUR CODE BETWEEN THESE LINES OF STARS
    % Visit all of the neighbors around the current node and update the
    % entries in the map, f, g and parent arrays
    %

    numExpanded = numExpanded + 1;
    currentNode  = [i,j];

    % This is for putting the nodes around the starting node
    upNode = [i+1,j];
    downNode = [i-1,j];
    leftNode = [i,j-1];
    rightNode = [i,j+1];

    % For the neighbors
    neighbours = [upNode; downNode; leftNode; rightNode];

    for n = 1:4
        % checks boundaries
        if (neighbours(n,1)>0 && neighbours(n,2)>0) && (neighbours(n,1)<= nrows && neighbours(n,2)<=ncols)
            % checks positions 1- white 2-obstacle 3-visited 4-onlist
            % 5-start 6-destination if the position is not an obstacle,
            % visited or the start or if it's destination, then calculate
            if( map(neighbours(n,1),neighbours(n,2)) ~= 2 && map(neighbours(n,1),neighbours(n,2)) ~= 3 && ...
                    map(neighbours(n,1),neighbours(n,2)) ~= 5 || map(neighbours(n,1),neighbours(n,2)) == 6)

                % adds to list and calculates distance to nodes
                if(g(neighbours(n,1),neighbours(n,2)) > g(current) + 1)
                    map(neighbours(n,1),neighbours(n,2)) = 4; % adds to list of expansion

                    g(neighbours(n,1),neighbours(n,2)) = g(current) + 1;
                    f(neighbours(n,1),neighbours(n,2)) = g(neighbours(n,1),neighbours(n,2)) + H(neighbours(n,1),neighbours(n,2));
                    parent(neighbours(n,1),neighbours(n,2)) = current;
                end
            end
        end
    end


    %*********************************************************************


end

%% Construct route from start to dest by following the parent links
if (isinf(f(dest_node)))
    route = [];
else
    route = [dest_node];

    while (parent(route(1)) ~= 0)
        route = [parent(route(1)), route];
    end

    % Snippet of code used to visualize the map and the path
    for k = 2:length(route) - 1
        map(route(k)) = 7;
        pause(0.1);
        image(1.5, 1.5, map);
        grid on;
        axis image;
    end
end

end
A* Test 10x10
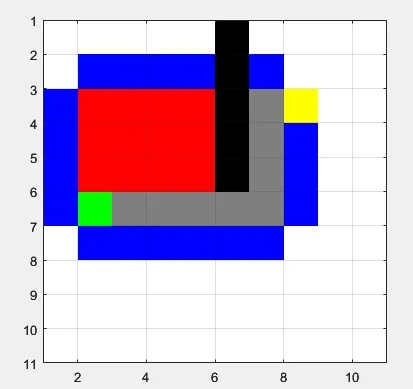
A* Test 25x25